Interactive visualization requires JavaScript
Related research and data
Charts
- Average learning outcomes
- Average learning outcomes vs. GDP per capita
- Average learning-adjusted years of schooling
- Average performance of 15-year-old girls and boys in mathematics
- Average performance of 15-year-old girls and boys in reading
- Average performance of 15-year-old girls and boys in sciences
- Average performance of 15-year-olds in mathematics, reading, and science
- Average years of schoolingBarro and Lee (2015); Lee and Lee (2016)
- Average years of schoolingUNDP
- Average years of schooling vs. GDP per capita
- Average years of schooling vs. expected years of schooling
- Average years of schooling, adjusted gender parity index
- Children and adolescents out of school
- Completion rate of lower secondary education
- Completion rate of primary education
- Completion rate of upper secondary education
- Duration of compulsory education
- Duration of pre-primary education
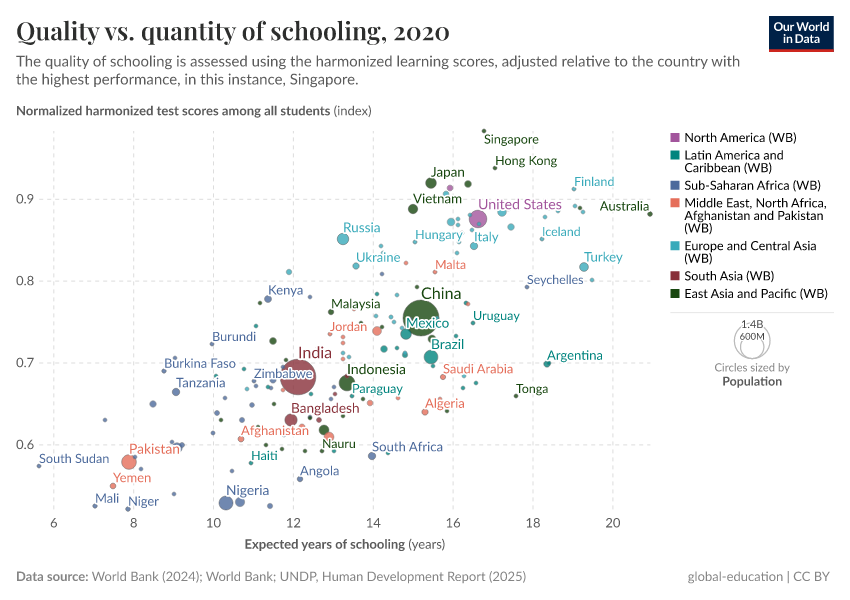
- Expected years of schooling
- Expected years of schooling vs. share in extreme poverty
- Gender gap in primary, secondary and tertiary education
- Girls and boys of primary school age who are out of school
- Girls and boys who are out of school
- Government spending on education as a share of GDP
- Gross enrolment ratio in secondary education
- Gross enrolment ratio in tertiary education
- Learning adjusted years of schooling in girls and boys
- Literate and illiterate world population
- Lower secondary school completion rates, adjusted gender parity index
- Net attendance rate of primary school
- Net enrolment rates in lower secondary education, adjusted gender parity index
- Net enrolment rates in primary education, adjusted gender parity index
- Number of adults with no formal education by region
- Numeracy rate in men
- Numeracy rate in women
- Official entrance age to compulsory education
- Official entrance age to pre-primary education
- Participation rate in formal and non-formal education and training
- Percentage of teachers in lower-secondary education who are qualified
- Percentage of teachers in pre-primary education who are qualified
- Percentage of teachers in primary education who are qualified
- Population by level of educationwith projections
- Primary school completion rates, adjusted gender parity index
- Primary school life expectancy, adjusted gender parity index
- Primary, secondary and tertiary education enrolment and completion rates
- Primary-school-age children who are out of school by world region
- Proportion of children aged 3-5 years who are developmentally on track
- Pupils per qualified teacher in primary education
- Share enrolled in private institutions at the pre-primary education level
- Share enrolled in private institutions at the primary education level
- Share of children achieving minimum proficiency in reading and math at each education level
- Share of children achieving minimum reading proficiency by the end of lower-secondary age
- Share of children achieving minimum reading proficiency by the end of primary education age
- Share of children in primary school age who are in school
- Share of male vs. female people who can use electronic presentation software
- Share of population with no formal education
- Share of primary schools with access to drinking water
- Share of primary schools with access to the Internet for teaching
- Share of primary schools with toilets
- Share of primary-school-age children who are out of school
- Share of primary-school-age children who are out of school vs. GDP per capita
- Share of schools with access to basic drinking water
- Share of schools with access to basic handwashing facilities
- Share of schools with access to electricity
- Share of schools with access to computers for teaching
- Share of schools with access to single-sex basic sanitation
- Share of schools with adaptations for disabled students
- Share of secondary school teachers who are women
- Share of students achieving minimum math proficiency by the end of lower-secondary education
- Share of students achieving minimum math proficiency by the end of primary education
- Share of students achieving minimum proficiency in reading and math at each education level
- Share of students achieving minimum reading proficiency by the end of lower secondary education
- Share of students achieving minimum reading proficiency by the end of primary education
- Share of students from abroad
- Share of students studying abroad
- Share of the population with at least some formal education
- Share of the population with lower secondary education
- Share of the population with no formal education with projectionsIIASA
- Share of the population with post-secondary education or higher
- Share of the population with tertiary education
- Share of the world's population with formal basic education
- Share of women graduating from STEM programs in tertiary education
- Upper secondary completion rate, adjusted gender parity index