Interactive visualization requires JavaScript
Related research and data
Charts
- Annual working hours per person employed
- Annual working hours per workerLong-run data
- Annual working hours per worker vs. GDP per capita
- Annual working hours per worker, various sources
- Annual working hours vs. GDP per capitaPenn World Table
- Annual working hours vs. productivity
- Average annual working hours per worker
- Average effective age of retirement for men
- Average effective age of retirement for women
- Average weekly working hours of children
- Days off from work for vacations and holidays
- Gap in GDP per hour worked with respect to the United States
- Hours of work vs. GDP per capita
- Productivity: output per hour worked
- Weekly working hours
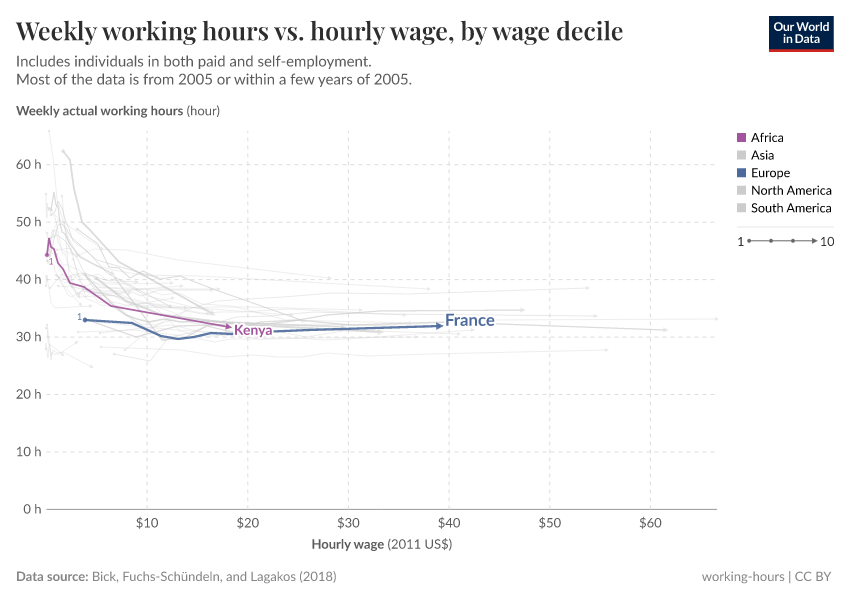
- Weekly working hours vs. hourly wage, by wage decilePaid employment only