Interactive visualization requires JavaScript
Related research and data
Charts
- Age group with the largest population
- Annual change in GDP, population and CO₂ emissions
- Annual population growthwith UN projections
- Birth rate and death rate
- Birth rate vs. death rate
- Births and deaths per yearwith UN projections
- Births by year and world region
- Births per yearwith UN projections
- Child deaths per year
- Children per woman vs. Natural population growth
- Children under age 15, by world region1950 to 2100, with UN projections
- Children under age 5, by world regionwith UN projections
- Contraceptive usage: modern methods vs. any methods
- Crude death rate
- Crude death rate: the share of the population that dies each yearWHO
- Crude death rate: the share of the population that dies each yearIHME
- Crude death rate: the share of the population that dies per year
- Deaths per yearwith UN projections
- Deaths per year, by age group
- England's economy over the long run: GDP per capita vs. population
- England's economy over the long run: GDP vs. population
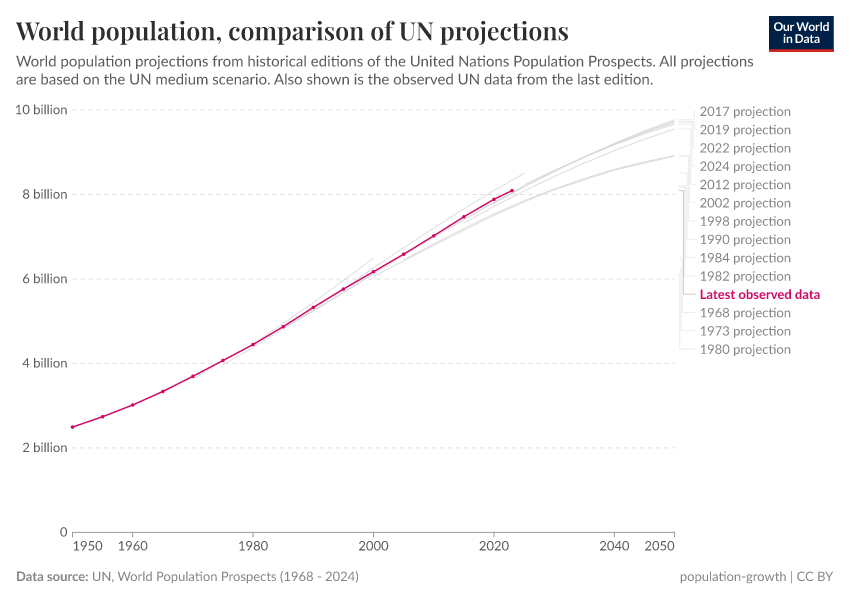
- How do UN Population projections compare to the previous revision?
- Natural population growthwith UN projections
- Natural population growth rate vs. child mortality rate
- Natural population growth rate vs. median age
- Number of children under 5 years old
- Number of deaths, by world region
- Number of live birthsHFD
- Number of one-year-olds
- Population1950 to 2100, with UN projections
- Populationsince 10,000 BCE
- Population10,000 BCE to 2100, with UN projections
- PopulationSince 10,000 BCE
- Population
- Population by age group1950 to 2100, with UN projections
- Population by age groupStacked area chart
- Population by age groupBar chart
- Population by income levelWorld Bank
- Population by world region10,000 BCE to 2100, with UN projections
- Population growth ratewith UN projections
- Population growth rate by level of developmentwith UN projections
- Population growth rate with and without migration
- Population of England over history
- Population of young, working-age and elderlywith UN projections
- Population of young, working-age and elderly
- Population, comparison of United Nations projections1950 to 2100, with UN projections
- Prison population rate
- Share of births registered
- Share of global consumption-based CO₂ emissions and population
- Share of population living on less than $5 per day
- Share of women using contraceptives
- Share of women who have the next birth
- The demographic transition in England and Wales
- The demographic transition in Sweden
- Total fertility rate with projectionswith UN projections
- World population growthSince 1700
- World population, comparison of different historical sources